CCCCUE: Generating C4 diagrams with CUE
On architecture diagrams
Doodling and drawing diagrams are part of my job.
The IT architects tend to find a good level of abstraction to represent the plans of whatever asset (on a scale of the company, to the software component).
A standardized level of abstraction is called a model.
In IT architecture, I like the simple ideas of the c4 model invented by Simon Brown.
Thanks to the CUE language, this article will expose a way to draw diagrams as data.
C4 in a glimpse
The C4 model is inspired by a famous model called UML. One of the goals of the C4 model is to make it easier for software developers to describe and understand how a software system works. The idea is to represent the architecture of software on different layers. Each layer is a “C” (C1, C2, C3, and C4)
The four C stands for:
- Context (C1)
- Containers (C2)
- Components (C3)
- Code (C4)
Think of it as a different level of zoom of a global architecture… the more C you have, the less abstraction.
For more information, please refer to the official documentation of the model.
C4 in my job
In my job, I like to draw diagrams. The abstraction needed by diagrams depends on the audience. The tradeoff is most of the time to design a C1 and fill it with elements from the C2.
So why do I say C1/C2? Because I genuinely think that starting from a System in C1 and completing it with the containers of C2 with a live preview is a great way to align people and share some understanding of the context. The C1 part refrains the technological-driven solutions to take over the workshop, while the C2 validates that the technological choices are in sync with the context.
In short, a C1/C2 is helpful to align the participants of a workshop and agree on the scope of the software.
Before the pandemic, we used to do that on a whiteboard. Nevertheless, the Work-From-Home made screen sharing a first-class citizen of any workshops. Therefore, I think it is an excellent opportunity to use digital tools to do better c4 modeling.
Diagram-as-code: Plantuml for great and the good
There are a lot of pros to diagrams-as-code. One of the most commonly exposed is that they are easy to version; therefore, you can host them with your code.
I have another advantage: you let an algorithm take care of the placement. If you are familiar with a tool such as Graphviz (or mermaidjs), you probably understand how cool it is to focus on the content while letting a machine take care of the presentation.
Plantuml is a tool that gives you the power to code your diagrams. You express your charts in code by calling essential functions with parameters, and the Plantuml is responsible for turning it into a visible representation. The tool is extensible, and a library has been developed to draw C4 diagrams.
For example, if you want to create a simple diagram with one system, you include the library and call the System function with the correct arguments:
@startuml C4_Elements
!include https://raw.githubusercontent.com/plantuml-stdlib/C4-PlantUML/master/C4_Container.puml
System(systemAlias, "Label", "Optional Description")
@enduml
Along with the VSCode Extension, I use it to draw diagrams in live sessions during remote workshops (it can even work with LiveShare).
The problem is that the code can become messy and introduce extra cognitive load over time. If a machine raises any additional level of complexity, it stops being useful.
For example, adding eye candy to your diagrams such as “tags” or “icons” is somehow tricky because you have to know how to call the functions correctly:
- Have you noticed the “Optional Description” in the example?
- What happens if the description is not present?
- The documentation of the System fonction is:
System(alias, label, ?descr, ?sprite, ?tags, $link); - for a container, the function is:
Container(alias, label, *techn, ?descr, ?sprite, ?tags, $link): adding a sprite and a technology is manual and the tags is a string of elements separated with+.
Trust me, it is doable, but it can become a nightmare to maintain.
On top of that, modularizing the code and creating custom libs of tags and sprite is painful.
Please don’t shoot: I know it is slightly against the C4 model to add such elements, but most of the time, it makes the diagram more powerful and easy to maintain.
Diagram-as-data
One way to overcome the problem of knowing how to call the functions would be to get rid of the code and fully describe our diagrams with data.
For example, I could describe a system via a schema and a container in a namespace c4 and instantiate objects of types c4.system and c4.container. Let’s write down an example:
Consider this definition
-
a c4.system is made of:
- an id
- a label
- an optional description
- an optional sprite
- an optional list of tags
- an optional line
- an optional list of containers associated with the system
-
a c4.container is made of:
- an id
- a label
- an optional technology
- an optional list of tags
and then these declarations:
-
referenceSystemis a system whosenameiscompanyWebAppandLabelis"WebApp". It is concrete because all the mandatory fields are filled. -
Then, for a particular project, we can declare
myprojectsystemas areferenceSystemwith adescription(for example, This is the webapp of my awesome project).- Now we have
myprojectsystemwhich is a typec4.systemandreferenceSystem. - On the same principle, we can declare a container
mycontainerinto the project and:- add this container to
myprojectsystemturing it into a C2 diagram, or, even better. - define a system
myprojectsystemC2of typemyprojectsystemand add the container tomyprojectsystemC2.
- add this container to
- Now we have
If we change the description of myprojectsystem, it will change the myprojectsystemC2 as well, the same mechanic applies if we add a tag to myprojectsystem or a new field to c4.system.
Sounds fascinating but still abstract or complex to realize… let’s dig into a concrete implementation. Hopefully, this will clarify things.
CUE to the resCUE
CUE is a configuration language. In the pure sense of the term, it is a programming language: it turns strings and graphical elements into machine output (see the Wikipedia page for Programming language).
Therefore we will use the language to express the component of the C4 domains and create the configuration of our diagrams as exposed before.
The schema definitions
Let’s take this definition from the cuelang website:
A data definition language describes the structure of data. The structure defined by such a language can, in turn, be used to verify implementations, validate inputs, or generate code.
Many standards exist to define the schema, but we will use CUE because of its ability to unify the schema and the values (remember, referenceSystem, a value that became the type of another element).
This reason itself is sufficient to advocate the usage of CUE, but, eventually, we may also benefit from its power to validate backward compatiliby, or combine constraints from different sources (eg. myprojectsystem2 can be a projectsystem and a anotherProjectSystem).
More about this on the chapter Schema Definition of the CUE website.
Practical example
To illustrate and play, let’s define a test.cue file and add some definitions for basic elements systems and containers:
#System: {
	id:           string
	label:        *id | string
	description?: string
	containers?: [...#Container]
// some fields described before are omitted for clarity
}

#Container: {
	id:           string
	label:        *id | string
	description?: string
// some fields described before are omitted for clarity
}
A bit of explanation about the syntax - CUE’s survival kit:
- the
#: this indicates that the field/id is a definition - the meet operator
a & b: indicates that the value is the result of the meeting of the operandsaandb. Therefore a valueval: 3 & 2is an error, butval: 3 & <4is possible andval’s value is concrete and is3.val: >2 & <4is possible but is not concrete; therefore, it will raise an error at evaluation time (we’ll see this later). - the join operator
a | b: indicates that a value isaorb. i For example,val: 3| 2is but at evaluation time, it will raise an error, because it cannot determine the final value ofval. We use the*to specify the preferred value. Thereforeval: 3 | *4will be evaluated asval’s value is 4.
Now, let’s add the difinitions of the example of the last paragraph in the test.cue file:
-
referenceSystem
is a system whosenameiscompanyWebAppandLabelis“WebApp”`:referenceSystem: #System & { id: "companyWebApp" label: "WebApp" } -
myprojectsystemis areferenceSystemwith adescriptionmyProjectSystem: referenceSystem & { description: "This is the webapp of my awesome project" } -
we can declare a container
mycontainermyContainer: #Container & { id: "mycontainer" } -
we define a system
myprojectsystemC2of typemyprojectsystemand add the containermyProjectSystemC2: myProjectSystem & { containers: [myContainer] }
Evaluation
Let’s now examine our configuration. The logic of CUE is to read the file (remember this idea of language…), unify the configuration and seek concrete values. All values must eventually converge to a concrete element, which means nothing is left blank.
Running cue vet test.cue will ensure that the file we created is complete.
Then, internally, CUE can resolve the references and substitute or subsume the placeholders’ values.
Let’s see that in action by running cue eval to evaluate the file and dump the result of the evaluation:
// cue eval test.cue -c
referenceSystem: {
    id:    "companyWebApp"
    label: "WebApp"
}
myProjectSystem: {
    id:          "companyWebApp"
    label:       "WebApp"
    description: "This is the webapp of my awesome project"
}
myContainer: {
    id:    "mycontainer"
    label: "mycontainer"
}
myProjectSystemC2: {
    id:          "companyWebApp"
    label:       "WebApp"
    description: "This is the webapp of my awesome project"
    containers: [{
        id:    "mycontainer"
        label: "mycontainer"
    }]
}
We can also run a query to dump object myProjectSystemC2:
// this is the result of the command: cue eval -e myProjectSystemC2 test.cue
id:          "companyWebApp"
label:       "WebApp"
description: "This is the webapp of my awesome project"
containers: [{
    id:    "mycontainer"
    label: "mycontainer"
}]
So far, so good, everything is resolved, and myProjectSystemC2 is filled with all the information. The system is self-sufficient.
The complete DSL
It is beyond the scope of this article to describe the complete logic or tooling around CUE. I’ve collected all the definitions required to express my diagrams and encapsulated them into a module.
This module is hosted on GitHub in the repository owulveryck/cue4puml4c4.
You find the definitions to setup the diagrams:
#System: the fundamental element of a C1#Person: representing a persona#Container: the additional component for a C2#Relation: an element to link two other components
The definitions to add tags:
#ElementTag: a tag that can be added to a person, a system or a container#RelationTag: a tag that can be added to a relation
On top of that, I described a notion of #Technology that can optionally hold a sprite:
#Technology#Sprite
Technology and sprites: I added a notion of Technology that can be added to various elements such as a container or a tag. A technology has a name and a type (three types are possible: “”, “Db”, “Queue”). It can also hold an optional sprite. A sprite has a URL. This will be helpful for the rendering via plantuml. For example, the “Go” technology is declared like this.
Go: c4.#Technology & {
	name: "Go"
	sprite: {
		url: "https://raw.githubusercontent.com/tupadr3/plantuml-icon-font-sprites/master/devicons/go.puml"
		id:  "go"
	}
}
I’ve also included three packages that import some common technologies/librairies:
github.com/owulveryck/cue4puml4c4/technology/devincludes all the icon sprites from tupadr3’s plantuml-icon-font-sprites repositorygithub.com/owulveryck/cue4puml4c4/technology/stdlibincludes all the icon sprites from plantuml’s stdlibgithub.com/owulveryck/cue4puml4c4/technology/gcpincludes all the icon sprites from the Google Cloud Platform
Rendering the diagram: plantuml as a renderer
Now that we have CUE objects representing our diagrams let’s render them. As promised, we will turn the CUE file into plantuml code and therefore use plantuml as a renderer.
The principle is to apply our configuration to a template file. CUE has a built-in template rendering engine imported from the Go world.
The syntax is therefore the same.
I’ve added a plantumlTemplate object inside the c4 package. This object is a template that should be applied to a c4.#C1 structure.
(https://github.com/owulveryck/cue4puml4c4/blob/main/template.cue)
Scripting
CUE is usable as a scripting language. We will extend the cue utility with a genpuml command to generate the plantuml file from the objects.
To add a command, we need to create a file with the _tool.cue suffix. And then add a command to a global command structure. A command is, therefore, treated like any other CUE value.
We will use the internal text/template package to process the template:
    import "text/template"
    //...
    text: template.Execute(c4.plantumlTemplate, C1)
Please note the C1 object, which is the one we’ve defined previously.
Then, for simplicity, we want to dump the result on stdout. To achieve this, we use the internal tool/cli package, which have a Print function:
    import "tool/cli"
    // ...
    cli.Print & {
       text: template.Execute(c4.plantumlTemplate, C1)
    }
Then, we need to create our command:
package main

import (
	"tool/cli"
	"text/template"
	"github.com/owulveryck/cue4puml4c4:c4"
)

command: genpuml: {
	c1: cli.Print & {
		text: template.Execute(c4.plantumlTemplate, C1)
	}
}
Now we can call cue cmd genpuml from the shell prompt; this will read and unify the configuration, apply the result to the template and dump the result on stdout.
The result can be processed by plantuml:
- on the command line:
cue cmd genpuml | java -jar ~/plantuml.jar -tsvg -pipe`- on a plantuml server:
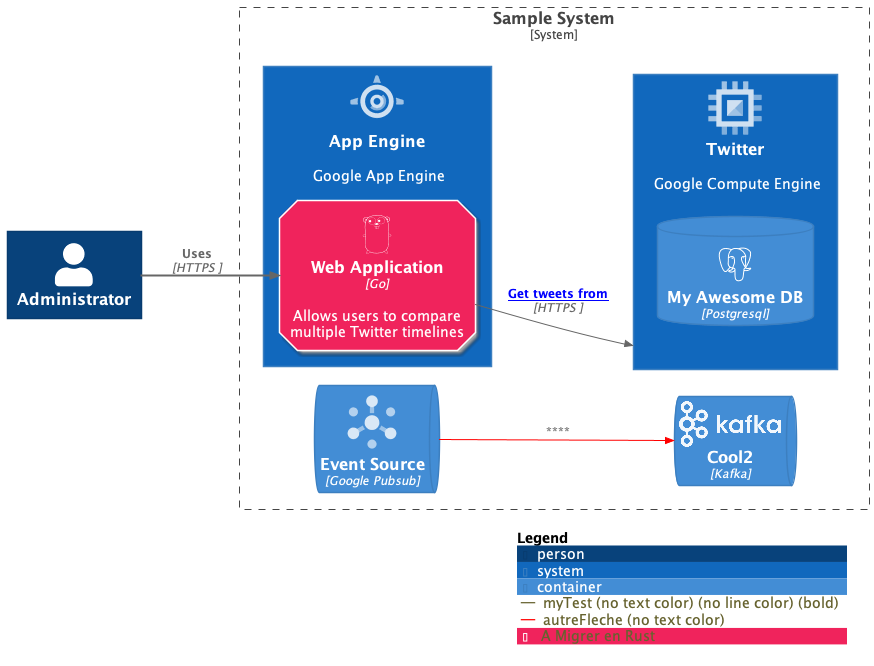
cue cmd genpuml | curl --silent --show-error --fail -H "Content-Type: text/plain" --data-binary @- http://localhost:8080/plantuml/svg/ --output -`A complete example is hosted in the cue4puml4c4 repository. It generates this picture (which is meaning-less :):
Bonus: Live preview
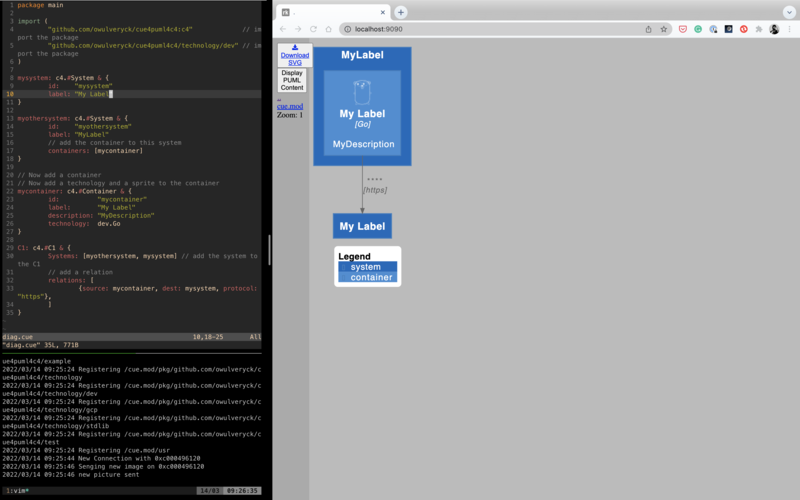
At the beginning of this article, I mentioned that I like to sketch my diagrams live in a workshop. I added a little utility that:
- monitor a file change in a directory
- calls de
genumplandplantumlon save - sends the result on a webpage via a WebSocket.
This allows a live view of the diagram we generate.
the source code is in the cmd directory on GitHub
Conclusion
I now have a new tool in my toolbox. The next step is to prepare a library of tags I commonly use. For example, I am doing a lot of migrations, and therefore a tags “toBeDeleted”, with a specific color may be helpful.
I also used the tool to create a diagram per service and create a sparse global view in distributed software. On top of that, I used the links to point to the administrative consoles or the monitoring straight from the picture.
The sky is the limit when you code…