Rationale behind wardleyToGo
Wardley Maps are a way of expressing business, market, or any other system through sketching. The Map is a sketch that offers situational awareness on a certain topic.
As a sketch, the obvious way to draw a map is with paper and pen.
While it is an excellent starting point, a paper representation of a map has a problem: it is static.
What I mean by this is that adjusting the placement of some components in the design phase can be tedious (even with a good rubber pencil).
Representing a map digitally presents a couple of advantages: they are easy to share and easy to maintain and exploit.
- Maintaining a map, is, in my context, the possibility to make some adjustments without changing its meaning (think of tweaks that can occur after a discussion with some peers).
- Exploiting a map is about understanding the landscape to orient future decisions.
Note: An important point to keep in mind when mapping is: a map shall not be used to illustrate the story you want to tell, the story should be extracted from the map.
In the orientation phase, being able to withdraw some elements from the map, for example, to focus on certain a path is useful.
Of course, we could record the creation history and do a couple of undo/redo to have intermediate representation, but this would imply that the creation steps were reflecting the path. This is orthogonal with the idea of seeking strategy through observation and then orientation.
The best way to have partial representation is, therefore, to have an intermediate representation of the map where we can easily comment blocks to hide elements.
Maps as code
In the design and maintenance phases, expressing a map as code present some flexibility.
The code is the source of the map and tooling and practices to manage source code are widespread (managing source code is a commodity).
Tools like git provide capabilities to:
- version and tag the map;
- collaborate on the map (even asynchronously or remotely)
- natively store the history of the map.
onlinewardleymaps is an online tool made by @damonsk. It is mature and widely used. To me, this tool has largely contributed to push maps-as-code into the stage II of the evolution (as described by Simon Wardley).
onlinewardleymaps definition language is called owm.
Taking my map “to go”
A first, the only version of the tool was an online version. This is good for the user experience as it does not require any setup to start mapping.
The problem is the coupling between the tool to render the map and the language. You cannot use owm outside of the browser.
Versioning the Map
The problem is that managing the source code was a bit tedious as it required a lot of copy/paste from and to the tools.
The Visual Studio extension, that appeared later, made is a bit simpler to manager the source code. In this sense, it heavily facilitates the versioning of the map.
But there is no way to easily export the map to store it with a peculiar version of the code as you need to export the map manually.
It makes it a bit difficult to take the map “to go” (or to take away depending on which flavor of English you practice (sic)).
Basic need: CI/CD
For years now, continuous integration (CI) and continuous delivery (CD) has proven some benefits in the release cycle of a digital asset. The idea is that every revision that is committed triggers an automated build and test. With continuous delivery, code changes are automatically built, tested, and prepared for a release to production
As I was able to commit the source code of my maps, I wanted to use a CI/CD mechanism to compile my source code and render my maps.
onlinewardleymaps does not provide any SDK allowing me to use the rendering engine in a headless building process. As a geek, I could have raised an issue and start contributing to the project. But I wanted to build my own to deeply understand how to build a map from the inside and because I found it fun to have one more side project.
Building an SDK to draw map “as code”
I am a big fan of the Go language for various reasons. In a glimpse the reasons I am using Go for my SDK are:
- I find it fun to code in Go;
- I master the language enough to speed the development and to focus on the design of what I want to achieve;
- the language is suitable to build “Ops tools”.
Naming things is hard, I named my SDK warldeyToGo (take your map “to go” with Go).
The design of the SDK is:
- a central package that acts as an intermediate representation of what a map is. (in a glimpse, it is a directed graph in which the nodes are components that are able to give their position in an euclidean canvas )
- a set of components that implements the intermediate representation and that are able to represent themselves in SVG (for example, I have Wardley Component and Team Topologies components)
- parsers to high-level languages that transpile the representation into the intermediate representation.
As a kickstart, I implemented a parser to the owm language.
So I can build my map with onlinewardleymaps, extract the source code (the owm representation) and build a tool with the SDK to transpile owm into the intermediate representation and render it into SVG.
A high level language to express map “as data”
So the SDK is truly allowing to code Wardley Maps. The owm syntax is therefore simply a user interface between the need to express a map and the representation.
Just as user interfaces are the conduit between humans and the functionality of products, products are the conduit between customers and the team of people solving a particular problem.
onlinewardleymaps is a solution to the need to represent a map digitally. wardleyToGo is a solution to code a map.
But what I was missing is a solution that allows a computer to assist me in the design of a map.
The problem with the Euclidean representation
The problem I face when designing a map with a tool based on Euclidean representation (such as owm) is that it requires me to think about the exact position of a component on the canvas (in terms of X and Y coordinates).
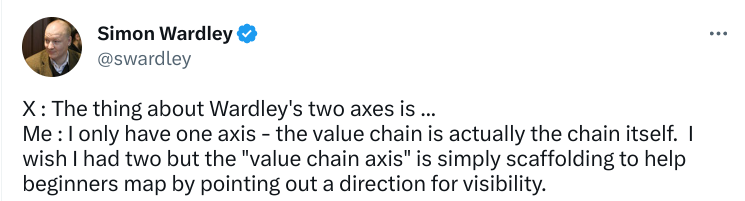
The main issue is with the vertical axis… which is not an axis:
On top of that, the evolution axis is decomposed into 4 stages, and placing the components on a certain stage requires the use of our system 2 (as described in the book "thinking fast and slow" by Daniel Kahneman)
A computer language to shape the way we think
So, my goal is now:
- To have a language that is easy enough to be used by my system 1
- That shapes the way I think of my map and therefore will help me in the design phase.
I can also add algorithms to assist me in the placement of the components. To do this, I need to implement a new language. The design of the wardleyToGo SDK makes it fairly easy to design a language through trial and error. The intermediate representation and the component libraries make the rendering easy and therefore make the feedback loop shorter.
Let’s now see what to expect from this new language that we will call wtg (for WardleyToGo… naming things is very hard)
Thinking about value chain and components: introducing wtg
Designing a map is basically a process in two steps:
- creating the value chain
- evaluating the components on the evolution axis
In the design phase: the position of the component on the evolution axis does not impact the value chain, and the visibility of the component (its vertical placement) has no impact on its position on the evolution axis.
On top of that, as seen before, the value chain is not an axis. Therefore, we can completely get rid of any euclidean representation in the first step.
Value chain
Visibility of the components is relative to other component.
The way we describe a value chain in wtg is by using a dash (-) to link components together. So a - b means that a depends on b. Then to place the component vertically, we can add more dashes.
For example:
a - b
a -- c
a --- d
means that this:

Note that the horizontal placement is, by now, meaningless
The vertical placement is computed by an algorithm. Therefore it allows me to focus on the value chain by itself.
Evolution axis
After building the value chain, we can place the components on the horizontal axis. This placement is a configuration of each component and independant of the value chain.
The syntax to place a component looks like this: |..|..x..|..|..| where each interval between two pipes (|) is a stage of evolution and the x is the placement of the component.
You can influence the placement within a stage by adding dots . before or after the x.
It is also possible to type the components (build, buy, outsource) or add colors. Further options can be easily added later.
The famous “tea shop” example looks like this in wtg:
business - cup of tea
public - cup of tea
cup of tea - cup
cup of tea -- tea
cup of tea --- hot water
hot water - water
hot water -- kettle
kettle - power

business:   |...|.....|...x.|..........|
public:     |...|.....|.....|..x.......|
cup of tea: |...|.....|..x..|..........|
cup:        |...|.....|.....|.....x....|
tea:        |...|.....|.....|.....x....|
hot water:  |...|.....|.....|....x.....|
water:      |...|.....|.....|.....x....|
kettle:     |...|...x.|..>..|..........|
power:      |...|.....|....x|.....>....|
You can build it step by step by following this tutorial
Conclusion and references
The wtg language suits my own need. I’ve made several maps with it.
It is beyond the scope of this article to fully describe the grammar. I started a website based on the divio documentation framework as a companion to the language. You can find the language reference on the wtg reference page.
There is an online version that can be used to create maps with the language easily. Even if I added some small features to the demo such as the ability to hide links in the chain to have a better observation of the components,the online version is a demo. Consider it as proof of value and not a production tool.
On top of that, a set of tools in CLI are present in the repository of the project. For example, there is a tool to monitor a wtg file and render it in the browser live. Therefore wtg could be edited with your favorite text editor and, you can present the map in a zoom call.
A nice feature I’d like to see in the future is the ability to group some elements and let the computer add a surrounding border in the rendering phase.
In conclusion, here is a simple map that tries to summarize the ideas exposed in this post:

You can play with the map by following this link