How to Activate the Value Flywheel Effect with Your Data
In today’s hyper-competitive world, businesses no longer rely solely on gut decisions or intuition; they depend on data-driven insights to stay agile and make fast, smart decisions. However, data alone isn’t the answer; it’s the enabler to create momentum on a business & technology flywheel: a model where data drives decisions, decisions drive actions, and those actions drive value, propelling the business forward in a self-reinforcing cycle.
In a previous post, I used a model to explain how data could cross the borders of applications and domains to bring increasing value at the organizational level.
Here is a synthesis of the development of the post: the X-Axis is about the increase of certainty of the decision correlated to its supply, and the Y-Axis the diffusion of the data correlated to its demand.

In this post, I am using YAML (Yet Another ModeL - sic) to determine how a data culture, technology and organisation can activate a value flywheel effect from a joint technological and business perspective.
By the end, you’ll gain actionable insights on analyzing and effectively implementing these principles within your own organization.
Description of the Problem
In the world of analytics, data holds immense potential to drive business value by generating actionable insights. Yet, it often remains constrained as merely an enabler of solutions within a specific business domain (the problem space). Because data is typically treated as a tool to address isolated business challenges, it rarely crosses the boundaries of its domain. This limits its ability to contribute to broader technological solutions or drive value across the entire organization.
This misalignment often stems from organizational silos. Even worse, Data and business teams frequently operate in isolation, leading to disjointed efforts where insights, no matter how robust, are either misunderstood or underutilized.
To address this, companies need to focus on creating a system that fosters collaboration between these teams. This is where the analogy of a wheel belt pulley system becomes relevant. Just as a pulley system transforms motion and power, an aligned approach to data transforms raw information into business value.
Imagine a flywheel as the driven wheel of the system—this represents the combined technological and business value. Data serves as the belt, facilitating the transfer of knowledge, context, and value across the organization. The key, however, is identifying the driver wheel: a smaller flywheel that focuses specifically on data maturity, accelerating business outcomes.
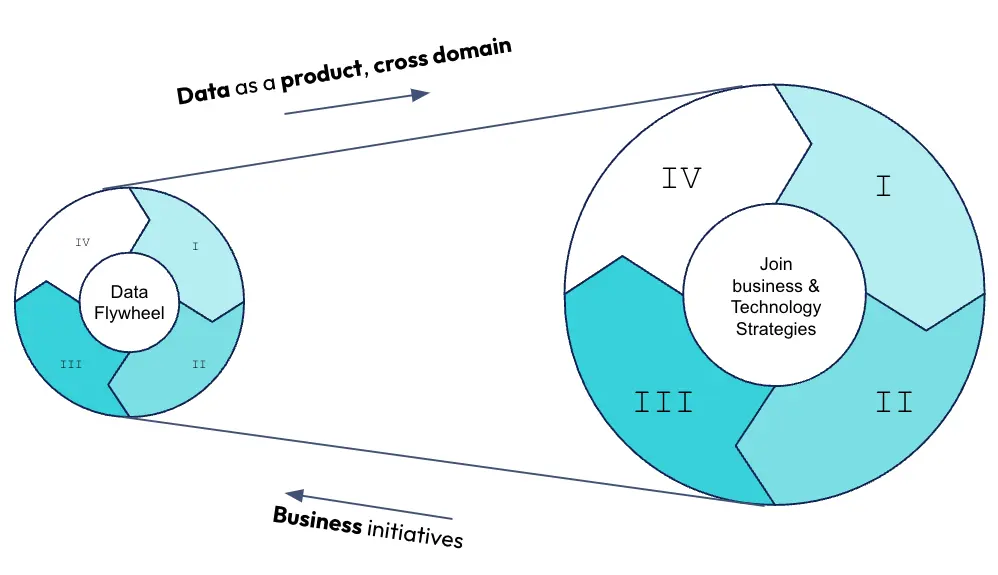
Let’s see now how companies can define and build this data-centric driver wheel in four steps, which will act as the engine powering the broader value flywheel of the organization.
The Value Flywheel Effect as a model
The original concept
I have met the concept of the value flywheel in the book The Value Flywheel Effect by David Anderson, with Mark McCann and Michael O’Reilly.
I love the introduction with the idea of momentum and I will simply copy here the very beginning of the book that you can find on the website of IT Revolution for free:
Momentum is a strange thing. It’s difficult to imagine what it will feel like and takes a great deal of effort to achieve. When we learn to ride a bicycle, for example, it feels clunky and awkward at first. It’s hard to get the wheels turning in the beginning, and our frustration is often evident. But our teacher assures us that it will pass. When we finally start to build momentum, the exhilaration takes our breath away. Every push of the pedal gets easier and takes less effort. Suddenly we can focus on the larger experience of gliding through a beautiful forest or tree-lined street. The value of our hard work is evident, and we can now continue to reap the benefits with less and less toil.
To fully understand the value flywheel effect, let’s first consider it from a broader business perspective. The most well-known application of the flywheel effect comes from Amazon, where small wins in customer satisfaction lead to more traffic, which attracts third-party sellers, which in turn results in lower costs and prices, creating further momentum. Each element strengthens the next, creating an ever-accelerating hub of growth, efficiency, and differentiated value.
The flywheel model describes a self-reinforcing system of momentum, growing stronger and easier to maintain as different actions compound over time. Instead of relying on giant, one-time shifts or changes, the flywheel works by multiplying the effects of small, consistent improvements. Once it’s moving, it’s hard to stop.
The Key tenets and the personas
I will refer to the model from the book The Value Flywheel Effect, which is the third iteration of this concept (following Amazon’s adaptation and the original idea by Jim Collins). This model is thoroughly explained in the book, and I highly recommend reading it. In summary, the value flywheel is broken down into four steps:
Clarity of Purpose → Challenge and Landscape → Next Best Actions → Long-Term Value
Each of the four steps drives the next one. Step by step, iteration by iteration, we overcome inertia (in a truly agile way) and build momentum.
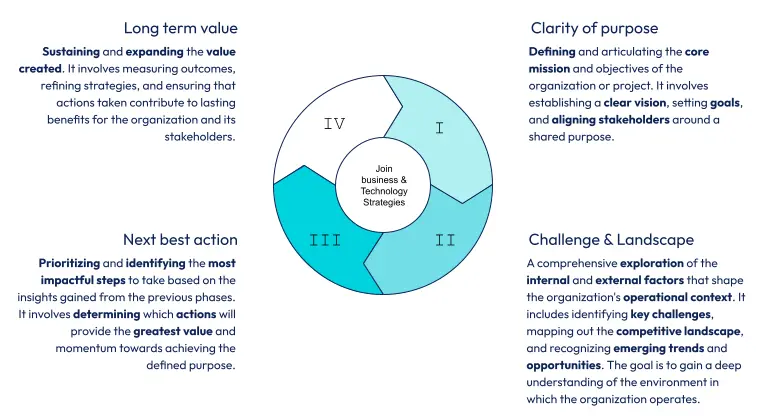
To summarize, here are the key tenets and personas of the Value Flywheel Effect:
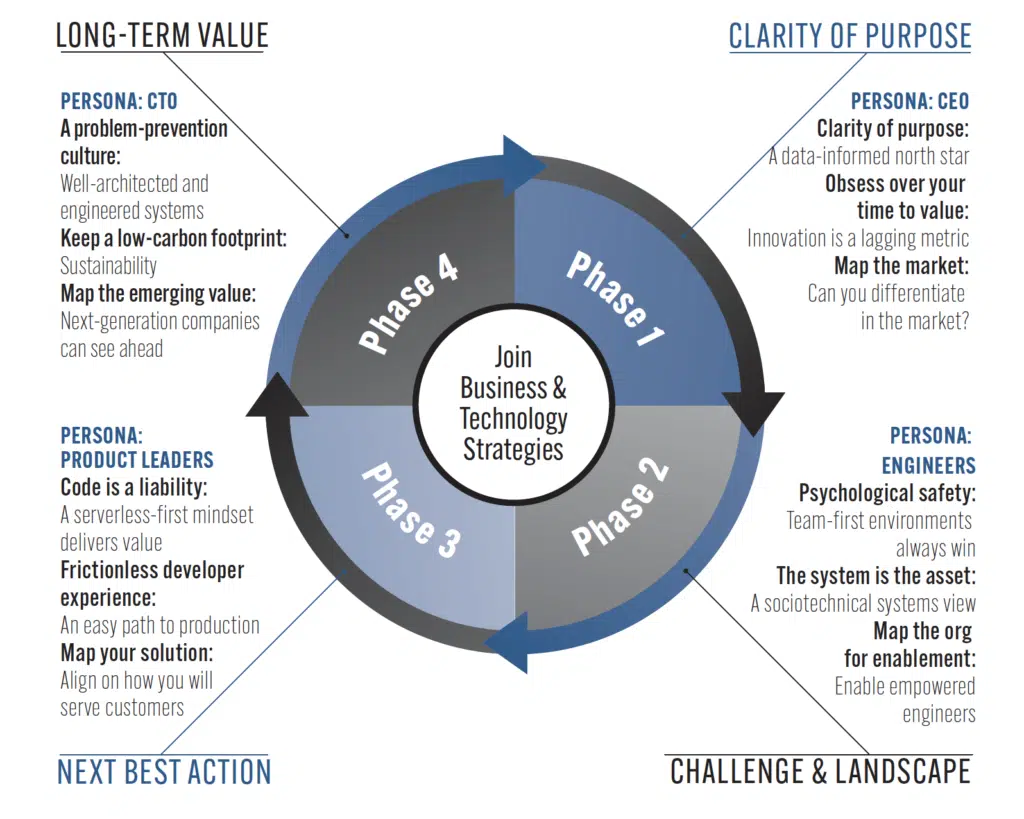
12 Key Tenets of the Value Flywheel Effect - David Anderson, Michael O’Reilly, Mark McCann - (c) ITRevolution
Now let’s see if we could adapt those key tenets to the data driver wheel. The first element is to consider the existing approach in place in the organization (Adapt > Adopt)
The Data Value Flywheel: Organizing the Data Ecosystem
To successfully apply the Value Flywheel Effect within a data ecosystem, companies need a structured approach to managing data across the organization. This is usually implemented thourgh the concept of the data factory. A data factory functions as the central engine that powers data-driven decision-making, ensuring that data flows freely between business and technical teams, transforming it into actionable insights.
At its core, the data factory is responsible for the end-to-end data lifecycle: from data collection and curation to storage, governance, and exposure for insights. It acts as a bridge between domains, enabling the seamless transfer of data from isolated business problem spaces to broader technological and strategic applications across the organization.
However, for the data factory to be effective, the data team must play a pivotal role within each domain. Depending on the governance of the organization, there are various data management models that can be adopted—centralized, distributed, federated, or data mesh. While these models differ in how they manage and organize data across the company, one constant remains: there is always a central data management team responsible for ensuring data consistency, governance, and alignment with broader business objectives.
Regardless of the model in use, this central team has crucial responsibilities. They serve as the guardians of the data ecosystem, providing the infrastructure, policies, and processes necessary for seamless data flow and collaboration.
With the Value Flywheel Effect, we can uncover the common tenets that guide the central data management team, allowing it to effectively drive momentum and accelerate value creation throughout the organization.
Now, let’s explore how the four phases of the value flywheel can be applied to (potentially) any aspiring data-driven company.
For clarity and coherence, I will adhere to the structure of the original flywheel effect, describing each phase in terms of its key tenets, the people responsible, and the major goal.
Phase 1 - Clarity of Purpose
The first phase is led by the Chief Data Officer (CDO), whose key responsibility is to sit at the executive level and define what it means for the company to be data-driven. This phase is about creating a North Star metric that encapsulates the company’s vision of being data-driven, particularly from a technological standpoint. The CDO collaborates with other executives to understand how data can support the company’s strategic objectives, ensuring that every initiative aligns with the broader business goals.
- Key Tenets: Alignment on business goals, establishing a data-driven North Star that clearly defines what it means for the company to leverage data as a competitive advantage and answer the question: what does it mean for us to be data-driven?.
- People in Charge: Chief Data Officer (CDO), Leadership, Domain Experts.
- Goal: Create alignment between data and business teams, ensuring that data initiatives support strategic goals and prevent misalignment between expectations and outcomes.
This clarity of purpose sets the foundation for all further activities in the data ecosystem, ensuring that the efforts of the data factory are always focused on delivering business value.
Phase 2 - Challenge and Landscape
Once the purpose is clear, the next phase is an engineering-led evaluation of the technical landscape. Here, the engineering team must assess the current systems and infrastructure to ensure they can meet the needs of a data-driven organization. This includes understanding the company’s technical capabilities such as the use of data lakes, data exchange architectures, and whether the company relies on an event-driven architecture. The team must identify what can be built in-house to support the data strategy set in Phase 1 and what components are better off sourced as commodities.
- Key Tenets: Assessment of technological debt, bottlenecks, data infrastructure, and the company’s ability to store, govern, and share data across domains.
- People in Charge: Technology Leads, Data Engineers, Architects.
- Goal: Understand what gaps exist in the current tech stack, ensure the right foundations are in place (e.g., event-driven architecture, data lakes), and decide on in-house development vs. commodity services.
The data factory in this phase needs to build the foundational capabilities required for long-term success, whether it’s scaling the existing tech stack or addressing technical deficiencies.
Phase 3 - Next Best Action
The third phase is led by product teams who must now focus on quick wins that can demonstrate immediate business value empowered by data. The goal here is to identify the data products or data insights that can catalyze business initiatives in the short term. These wins should be closely aligned with business objectives, such as improving sales forecasting to give a competitive edge in logistics or developing data-driven insights to support key strategic initiatives.
- Key Tenets: Iterative progress, focus on delivering quick wins, decentralized responsibility.
- People in Charge: Product Managers, Domain Leaders, Data Engineers.
- Goal: Develop and deploy data products that deliver immediate business value, focusing on initiatives that support short-term business goals while building momentum for long-term success.
Here, the data factory must provide scalable, agile support to empower domain teams to develop their own data products. The emphasis is on taking incremental steps to unlock value, ensuring that data products are aligned with business initiatives.
Phase 4 - Long-Term Value
The final phase focuses on securing long-term value, led by the CTO. At this stage, the goal is to ensure that the data systems and processes in place can support the ongoing evolution of the business. The CTO works closely with the CDO and the board to ensure that the data factory continues to develop as a key enabler of future data products and innovations. The focus is on scalability, governance, and sustaining the competitive advantage gained from being a data-driven company.
- Key Tenets: Scalability, governance, and creating a sustainable data ecosystem.
- People in Charge: Chief Technology Officer (CTO), Data Architects, Domain Data Teams.
- Goal: Architect a system that ensures long-term value by empowering teams to innovate continuously and making the data factory a platform provider for future data-driven business needs.
In this phase, the data factory transitions to a more supportive role, enabling continuous innovation while ensuring the infrastructure is robust, scalable, and adaptable. This phase also feeds insights back to the CDO and executive team, ensuring that the data strategy remains a competitive differentiator.
Conclusion: Activating the Flywheel
Let’s take a step back to review this mechanism:
The value flywheel is activated phase by phase, with the central data factory playing a crucial role throughout the journey toward a federated data management system. This ensures cross-domain consistency and the delivery of scalable solutions. By following this structured approach, the data landscape transforms into a coherent framework where every part of the organization—not just the central data team—contributes to the company’s long-term success.
This model provides a useful blueprint for explaining the potential of a data system within an organization. However, the implementation of each step lies beyond the scope of this article. There are numerous tools available—such as the North Star Framework and Wardley Mapping — that can support the application of this structure at each stage.